Countervailing forces are blurring the picture in Macau. The major casino stocks could go either way from here, though the picture should start to clear up a little bit by the beginning of May. As things stand now, it’s a gamble, as perhaps it should be. First, the bullish case.
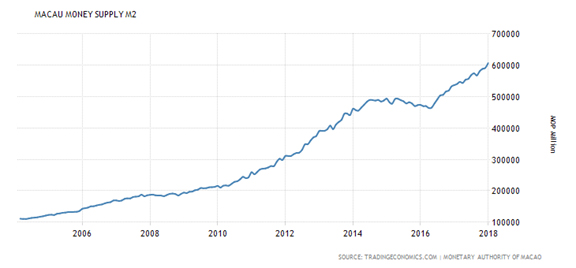
The biggest piece of evidence the Macau bulls have on their side is the Macau money supply.

You can see here the obvious dip in the MOP supply from March 2014 until about February 2016. It may be hard to see zoomed out like this, but there was also a plateau from late 2007 until early 2009. These of course correspond to the two major Macau crashes in 2008-09 and 2014-16. Judging from this chart, the money supply in Macau is climbing strongly, which means the current boom in Macau stocks can in principle keep going.
 Before we continue this line of thought, let me address the obvious objection to charting patacas to gauge the health of the Macanese economy. That is, Hong Kong dollars are accepted in Macau. True, but taxes in Macau are paid in Patacas, so all HKD is in the end exchanged for MOP and this chart reflects that.
The second piece of evidence supporting the Macau bulls is housing prices. The housing index in Macau only goes back to 2011, but the only significant dip it had was between March 2014 and February 2016. It has been edging back up ever since and has broken through the highs previously set before the Macau crash of 2014. It may start to slope down yet, but considering the strong money supply growth that looks unlikely.
Third, the price inflation rate has gone up only marginally since Macau bottomed in 2016. The lack of visible price inflation despite a strongly expanding money supply means that productivity gains are shielding consumer price gains from showing up nominally. This is a sign of a strong boom. Real price gains though still exist because prices would have otherwise fallen under the static monetary conditions.
Fourth, President Xi Jinping is now president for life. This doesn’t seem that great to Western ears especially, but all it really does is formalize what was previously unwritten. Why might this be good for Macau? Because Xi has already gone through a Macau collapse that his anti-money laundering policies directly caused. It’s up to him to decide if he’s going to go after the VIPs and the junkets and the graft and everything else that goes on there, and he knows what will happen if he does. If someone new were to come aboard, he may try what Xi already tried and restrict Macau in order to paint a legacy for himself as the Incorruptible Leader or whatever title he fancies himself earning.
Like all leaders, Xi wants to put his mark on the country and does not want to be remembered for messing up the economy. Could he mess with Macau again? Yes, I wouldn’t completely rule it out, but the chances of Xi tinkering with the Macau economy in any significant way at this point are much less than somebody new doing it trying to prove a point.
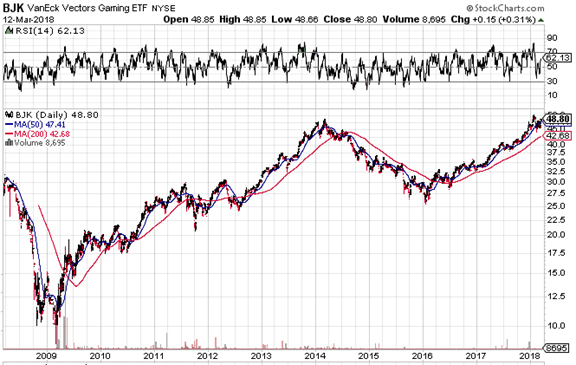
As for the bearish perspective, the VanEck Vectors Gaming ETF (BJK), made up of mostly Macau-focused stocks, is coming up on all-time highs. Accounting for long term ETF decay from fees, we are pretty much there already. This is major long term resistance now, which should give any technical trader some pause. Even if we do eventually break through it, it’s going to take some time and upside should be limited in the short term.

More fundamentally though, the dollar supply trumps the pataca supply as the world’s reserve currency. The dollar supply is entering into its final seasonal growth spurt which typically ends after tax day in the second week of April. But here’s the thing. In the seven-week period from the last week of February until the second week of April since 2010, the dollar supply has grown anywhere from 1.2% to 2.8%. Five of those years, 2012-2014 and 2016-2017, saw pretty much smooth price action through the summer for stocks generally, including Macau casino stocks. During those five years, the dollar supply expanded anywhere from 2.1% to 2.8% in those seven weeks.
There were three years though, 2010, 2011, and 2015, when during this period, the supply only grew 1.2% – 1.6%. Look back at BJK above and you’ll notice that 2010 was rangebound until a September breakout. 2011 and 2015 both had very rough summers with extreme downside activity. On top of this, we are already at the lowest growth levels for this time of year in at least the past 7 years, which means this summer could be particularly rough for stocks. We’ll know more by May, but so far it doesn’t look good.
Politically, the protectionist trade wars that the Trump Administration is leading could end up provoking China into retaliating, never a good thing for American companies doing business in Chinese territory. Now that it looks like Trump will be cleared from any collusion charges, he could start getting bolder in his moves against trade, with China long considered a major target. As US Treasury auctions approach record sizes, one thing that Xi Jinping could do is simply not show up at the next auction or two and that would really shake things up quickly.
Essentially, technical headwinds look to be making any short term upside in Macau very difficult, even if we were in a healthy political and monetary environment. It looks unlikely that these stocks will go much higher until September at the earliest.
One week average from last week of February to 2nd week of April
2017: 2.6%
2016: 2.1%
2015: 1.63% (august crash)
2014: 2.4%
2013: 2.8%
2012: 2.5%
2011: 1.2% (august crash)
2010: 1.2% (may-august correction)
2009:
2008: 3%